Parallel coordinates
Colour 199 40k
Scatterplot
X Y
price
year
cylinders
odometer
Gallery
Sort


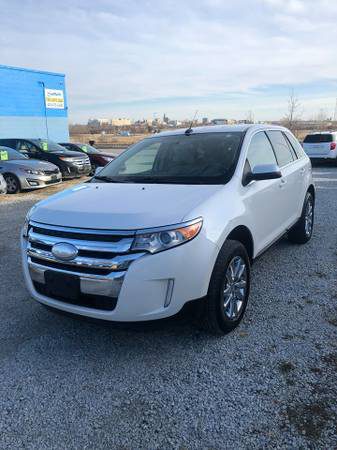
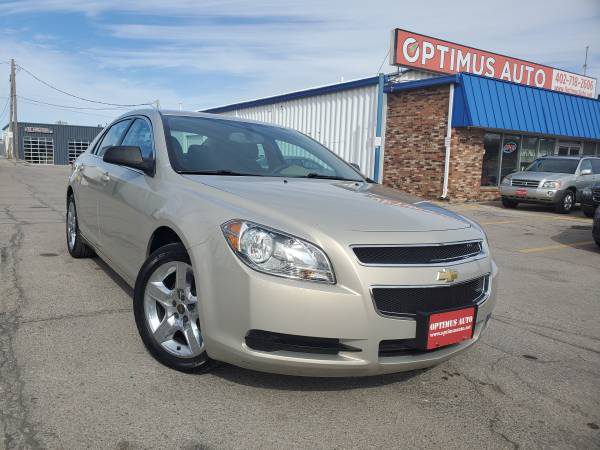
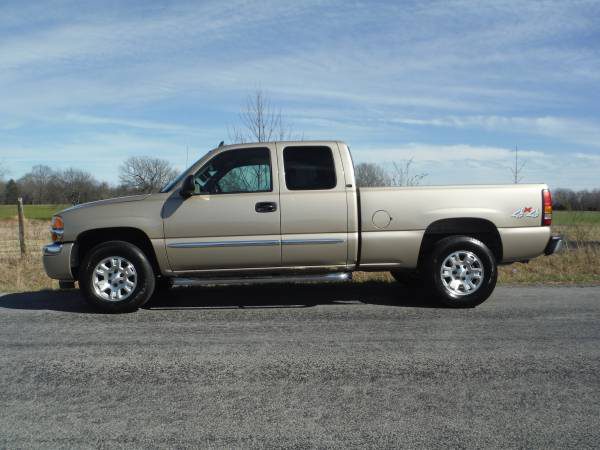

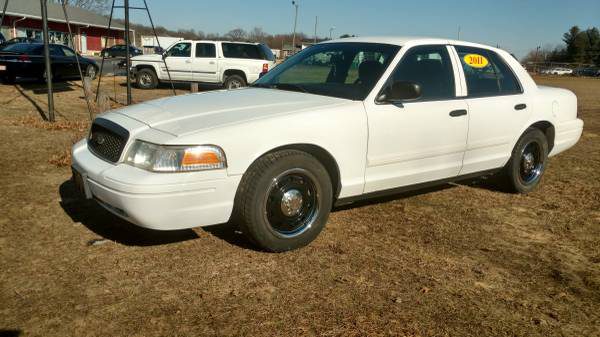
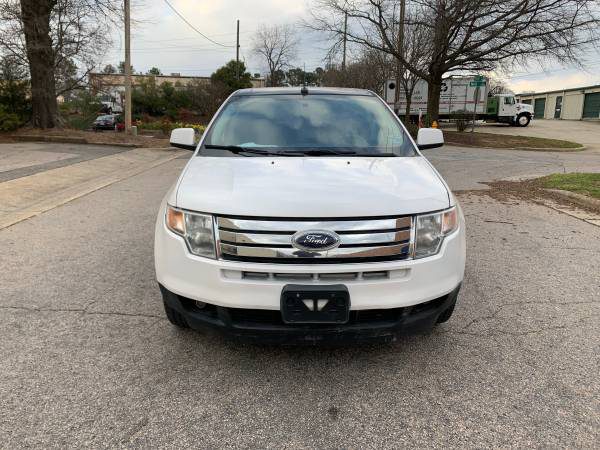
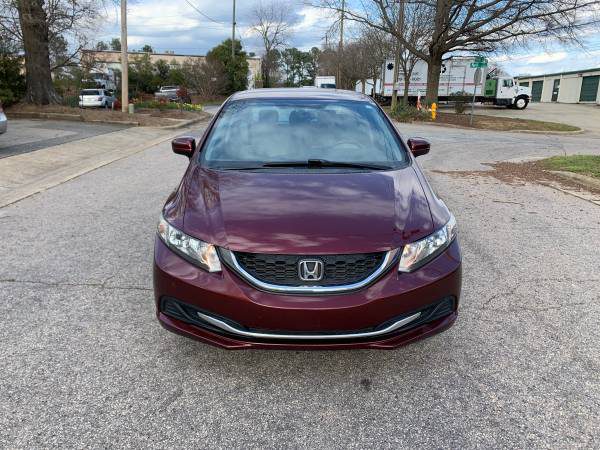
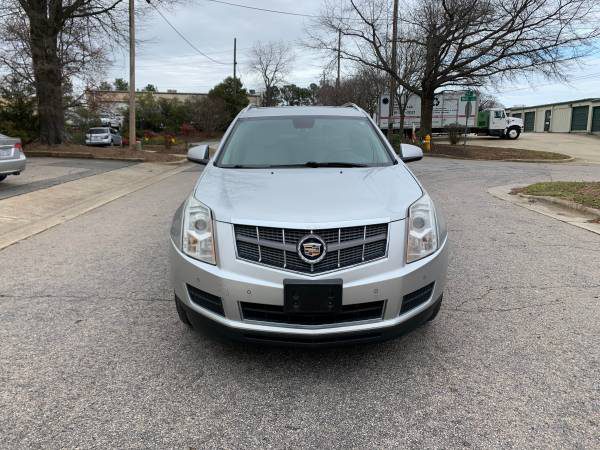
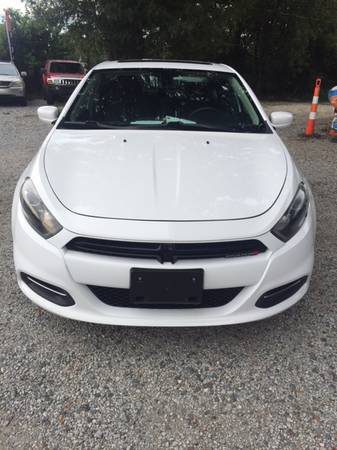
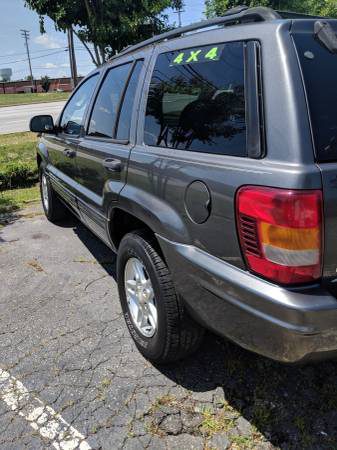
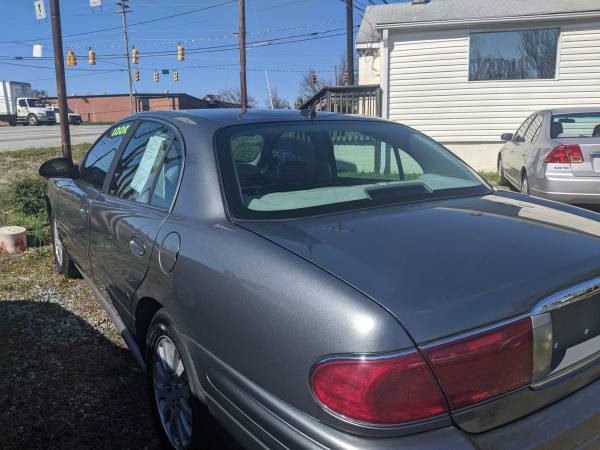

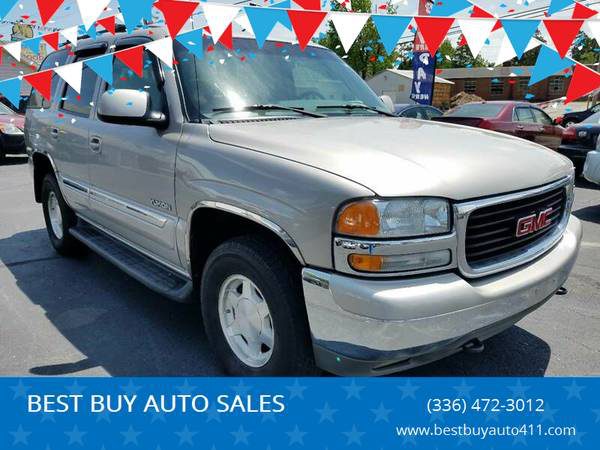
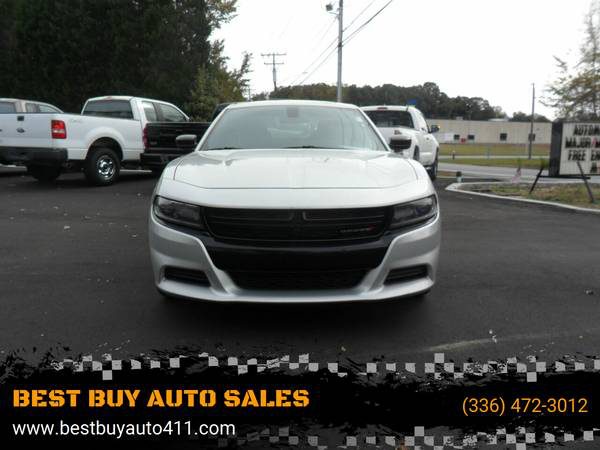
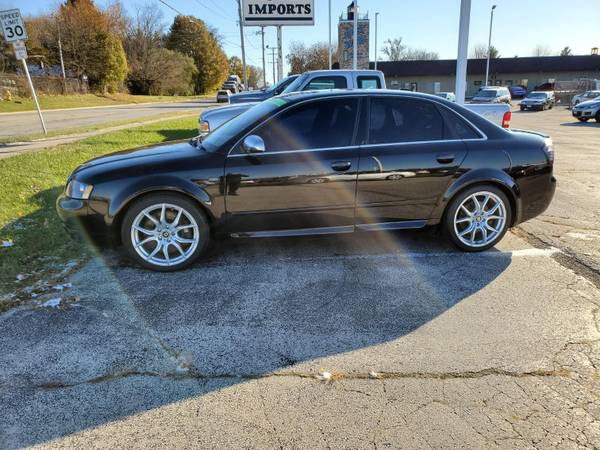
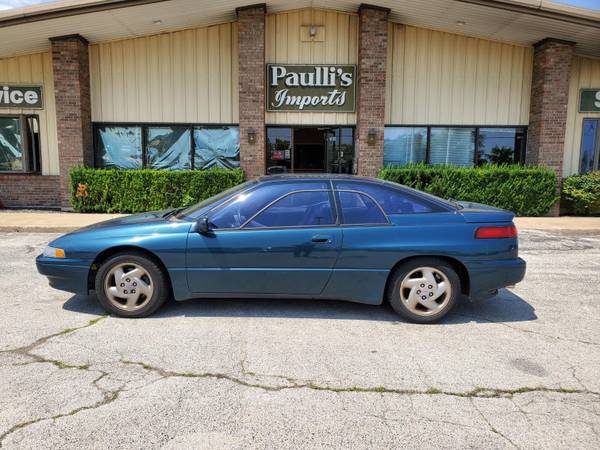
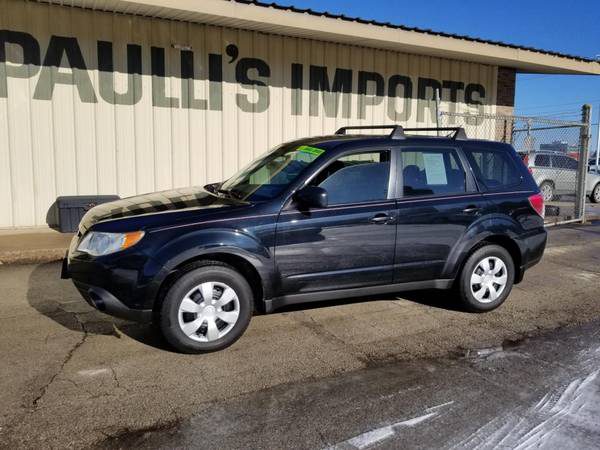
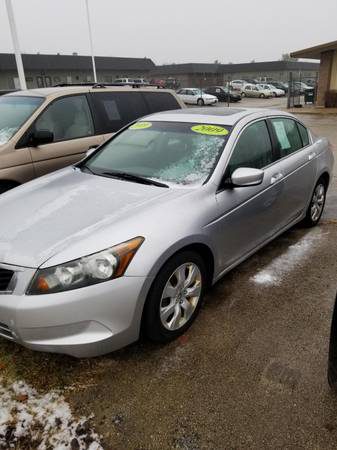
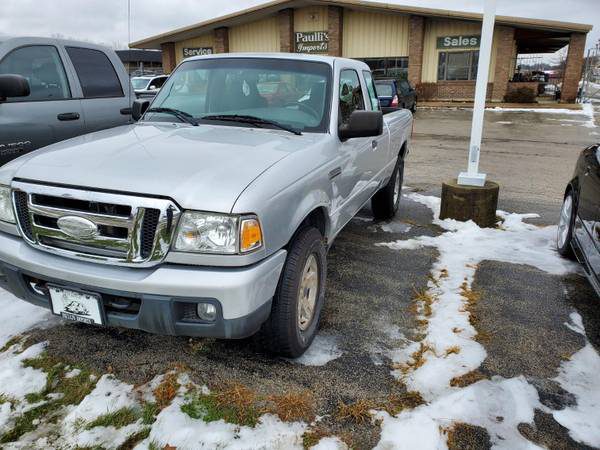
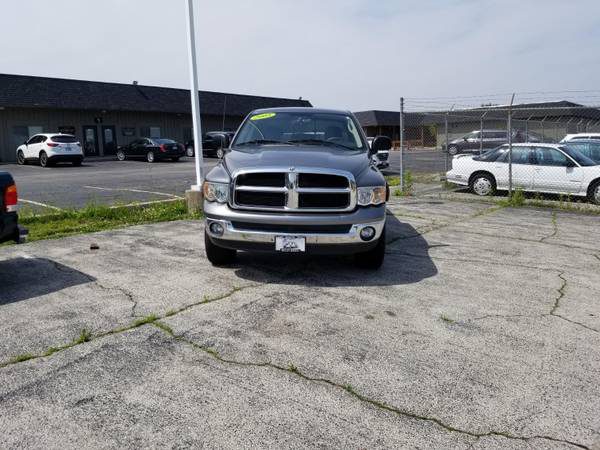
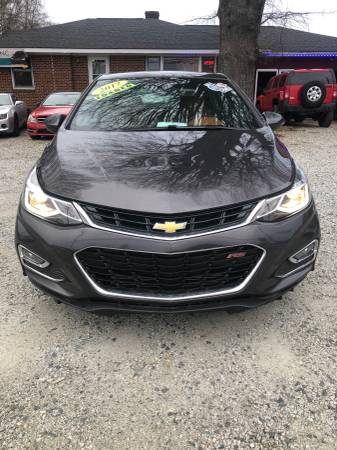
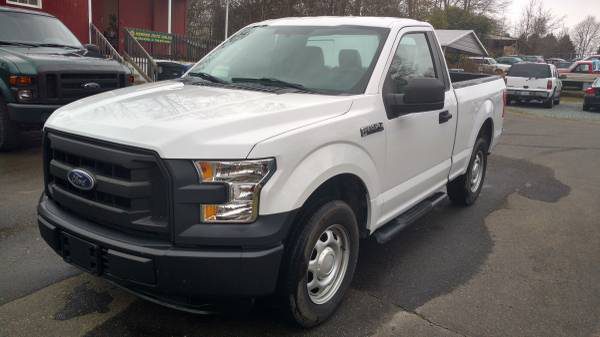
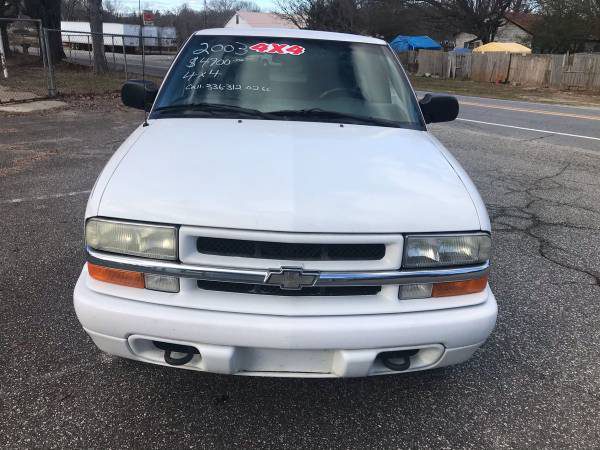
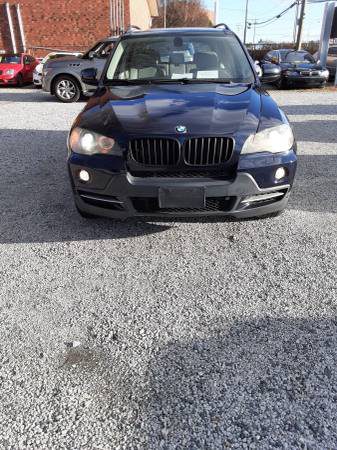
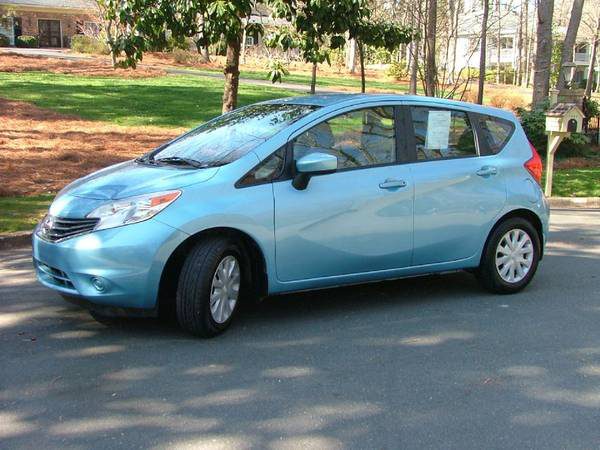
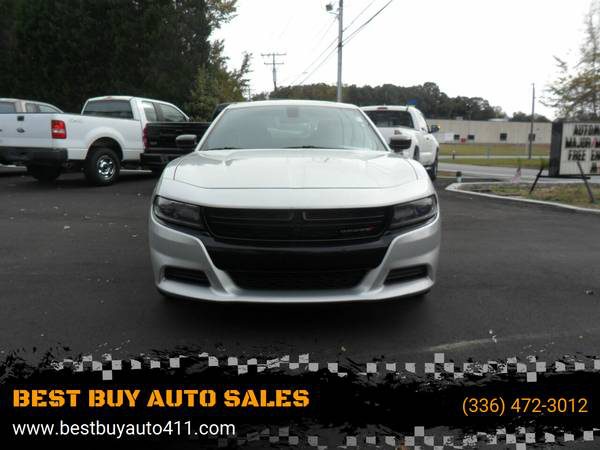
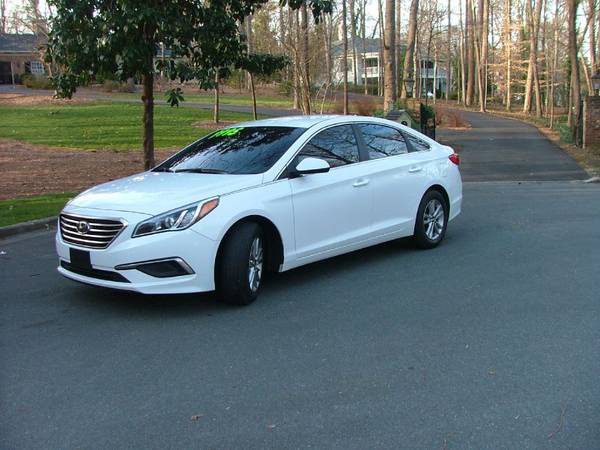


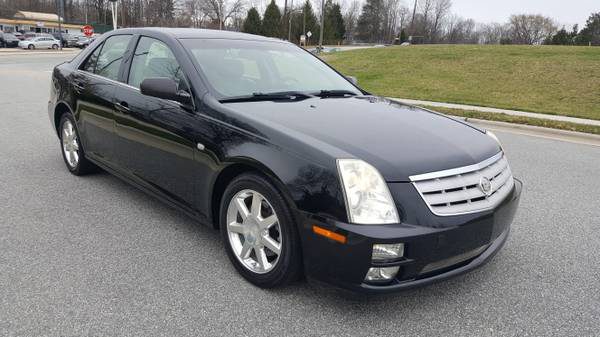
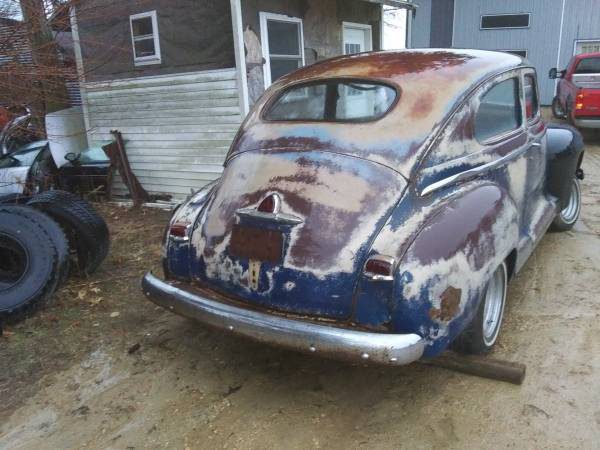
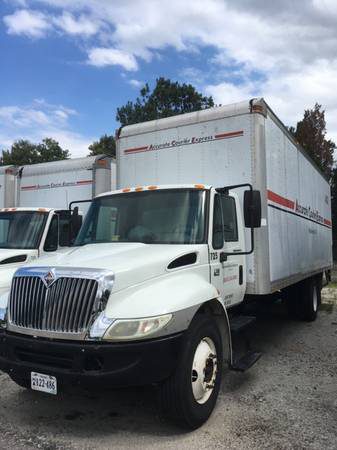

Share · Share and present
Capture views as you work. Each capture saves the filters, goals and shortlist, with a note. You can present your captures in a meeting or turn them into a PDF report. This menu also has a CSV download of the remaining options and a link that opens the same dataset for someone else. The link contains only the data, without your filters or sets.